
What are Filters in Data and Analysis?
The Data and Analysis page is where you view, search, and manage your raw survey responses. Qualtrics lets you apply filters to temporarily hide data you do not need so you can focus strictly on the responses that meet specific criteria. Filtering changes your immediate view, but it does not alter, delete, or permanently edit your original dataset.
Benefits of Using Survey Filters
When Should You Use Survey Filters?
Common Scenarios
Here are typical ways Iowa agencies use filters:
- Looking at feedback from specific age groups
- Example: Analyze only respondents aged 18 or older.
- Filtering by selected service or program
- Example: View responses where users selected a specific agency department or program type.
- Combining multiple conditions
- Example: See responses that match Age 18–34 AND Preferred Online Services AND Low Satisfaction.
- Comparing groups side-by-side
- Example: Compare feedback trends between older and younger users to identify potential digital accessibility gaps.
- Screening and cleaning responses
- Example: Hide test entries or remove participants who did not consent to the survey.
Resources
- How to Use Filters in Qualtrics Data and Analysis Video 2-Minutes
- Note: This video demonstrates how to create filter conditions, combine multiple criteria, save filter presets, and use filters to isolate specific respondent groups for targeted reporting.
- Qualtrics Support: Filtering Responses
- Qualtrics XM Community 2-Minute Tips Playlist
Instructions
Use the steps below to create a basic survey filter, add more filter conditions, and edit, duplicate, or delete existing filters.
Build and Save a Basic Survey Filter
- Open your Qualtrics survey.
- Click the Data and Analysis tab at the top.
- Click Add Filter.
You’ll see new dropdown menus appear where you can define your filter criteria.
Your data will filter automatically.
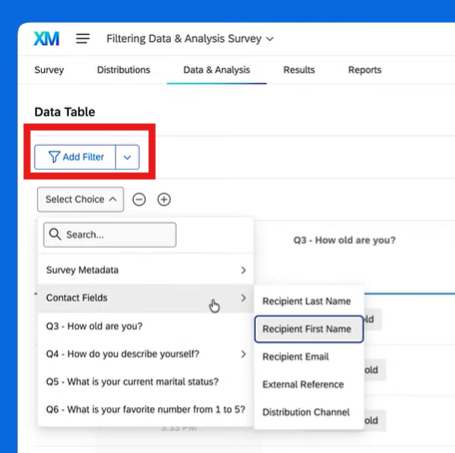
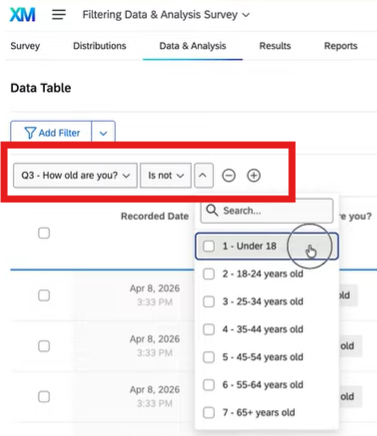
Special Note: Keep in mind that when you add a filter, you’ll see three key parts:
- Field: what you want to filter by, like a survey question, survey metadata, or embedded data.
- Operator: how the field relates to the value, like is, is not, contains, and greater than.
- Operand: the specific value or answer you want to isolate.
Adding Additional Survey Filter Conditions
If you need more than one filter condition:
- Click the plus (+) button next to your filter.
- Add your next field, operator, and operand.
- Continue adding as many conditions as needed.
- Give your filter a descriptive name.
- Click Save.
Edit, Duplicate, or Delete Filters
- Click the downward arrow next to the Add Filter button.
- Select Manage Filters from the dropdown menu.
- Click the arrow next to any saved filter.
- Choose: Edit, Duplicate, or Delete the trash can icon
- Review the filter ID and full list of conditions.