Purpose
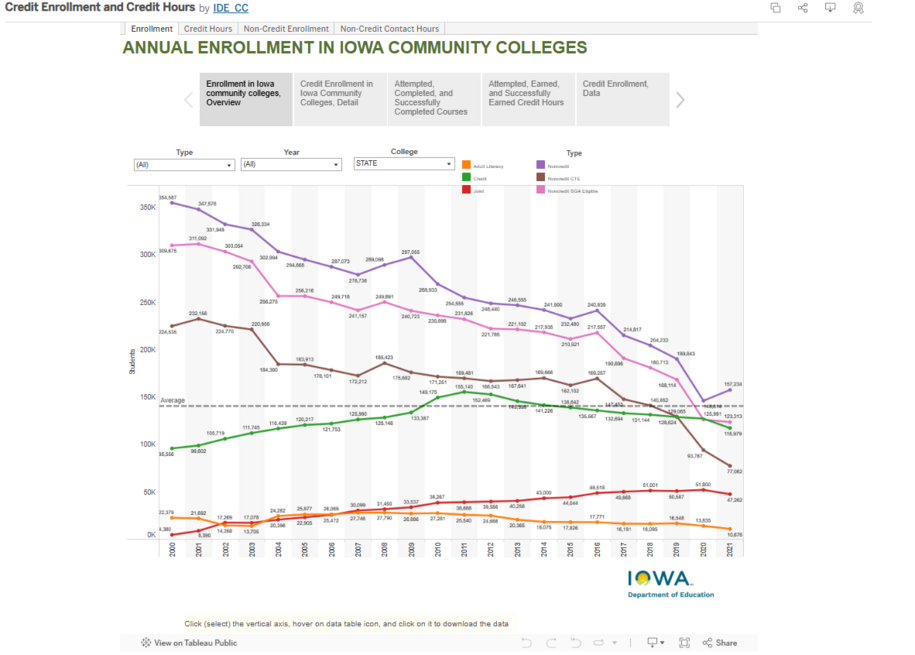
Tableau Visualization is a strong tool. It helps government departments turn complex data into clear visual displays. This helps to analyze trends, find patterns, and share insights with stakeholders.
When to Use the Basic Page Table of Content
Use Tableau Visualization when you want to:
- Simplify Complex Data: Break down a large dataset into smaller, more manageable chunks.
- Identify Trends and Patterns: Spot emerging trends or recurring patterns in your data.
- Communicate Insights Effectively: Convey complex information in a clear and concise way.
- Engage Your Audience: Make eye-catching dashboards and reports that grab attention.
Elements of Tableau Visualization
- Data Connection: You can connect Tableau to various data sources, such as databases, spreadsheets, and data warehouses.
- Drag-and-Drop Interface: Easily create visualizations by dragging and dropping fields onto the canvas.
- Visualization Types: Choose from a variety of visualization types, including bar charts, line charts, maps, and more.
- Customization: Customize the appearance of your visualizations with colors, fonts, and formatting options.
- Interactive Features: Add filters, tooltips, and drill-down capabilities to explore data in more detail.
- Sharing and Collaboration: Share your visualizations with colleagues and stakeholders through various formats (e.g., PDF, PNG, interactive web pages).
By using Tableau's powerful features, government departments can gain valuable insights, improve decision-making, and better serve their constituents.
Choosing the Right Tool: Tableau Public vs. Tableau Desktop
Tableau Public:
Benefits: Ideal for individuals and organizations who want to share data visualizations publicly and don't require advanced features.
- Free: No cost to use.
- Easy to Learn: User-friendly interface for beginners.
- Sharing Capabilities: Easily share visualizations publicly.
- Community Engagement: Connect with other Tableau users and learn from the community.
Limitations:
- Limited Data Sources: May have restrictions on data sources and file size.
- Public Sharing: Visualizations are publicly accessible.
- Fewer Advanced Features: Lacks some advanced features compared to Tableau Desktop.
Tableau Desktop:
Benefits: Suitable for businesses and organizations that need to analyze large datasets, create complex visualizations, and collaborate with teams.
- Powerful Features: Offers a wide range of advanced features for data analysis and visualization.
- Customizable Dashboards: Create interactive and customizable dashboards.
- Data Security: Provides robust security features to protect sensitive data.
- Offline Capabilities: Work offline and sync changes later.
- Collaboration: Collaborate with team members on shared projects.
Limitations:
- Cost: Requires a subscription fee.
- Steeper Learning Curve: May require more technical expertise to master advanced features.
Ultimately, the best choice depends on your specific needs and budget. Consider factors such as the complexity of your data, the level of customization required, and the need for data security when making your decision.
How to Add Tableau Visualization to the media library
You will first need to locate the url link of your tableau visualization by selecting the share button and then within the share pop up window you can select and copy the url within the "Link" field.
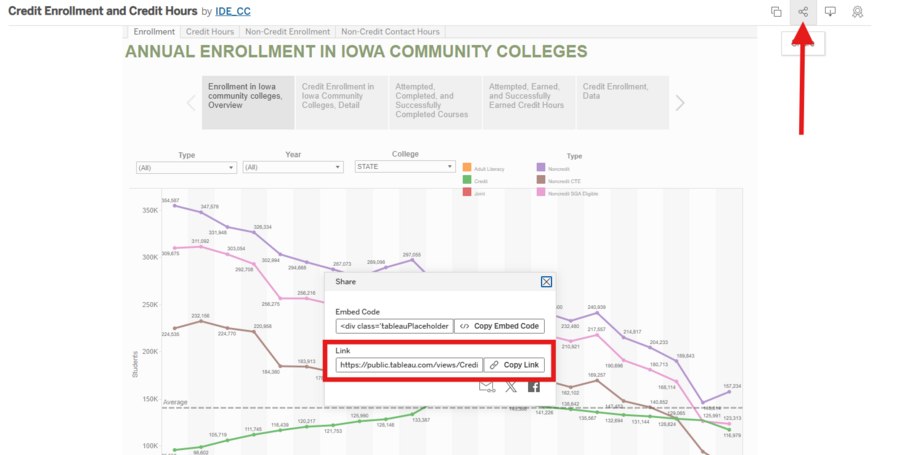
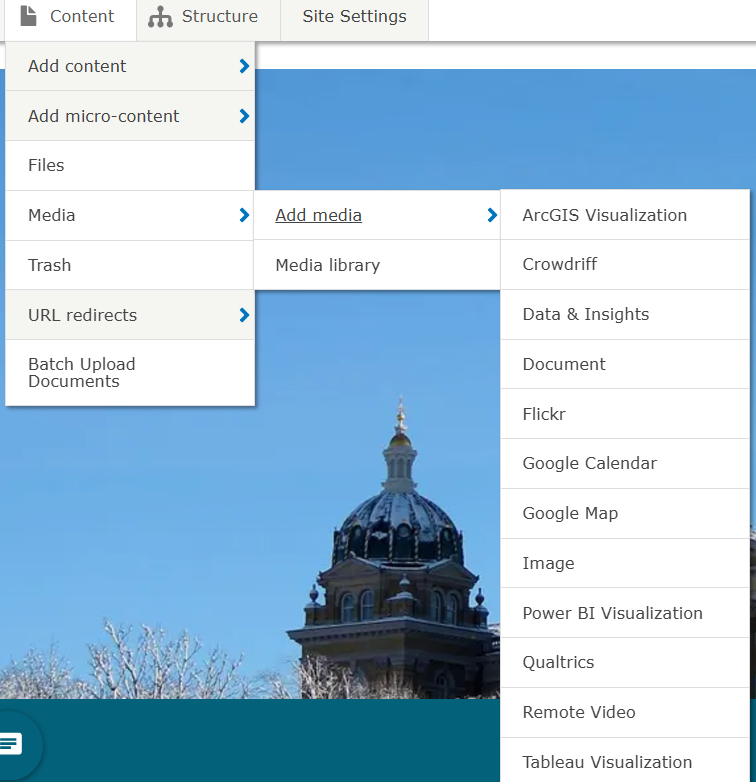
Tableau Visualization embeds can be added to your agency site by using the add media button within the content and then media dropdown window:
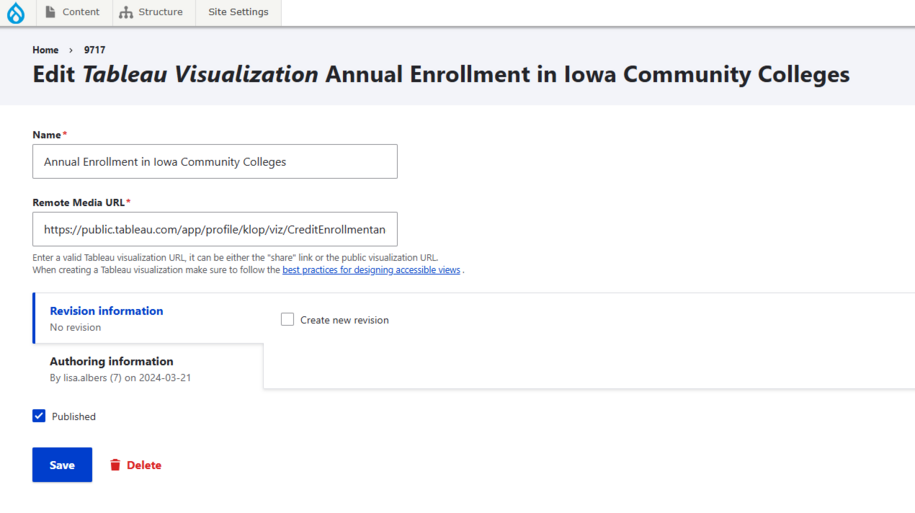
Once you've selected the Tableau Visualization button within the add media section you can then paste the link url that you copied from your tableau visualization page and then create the name of the embed so that it's easy to later search and locate it then lastly finish by selecting save:
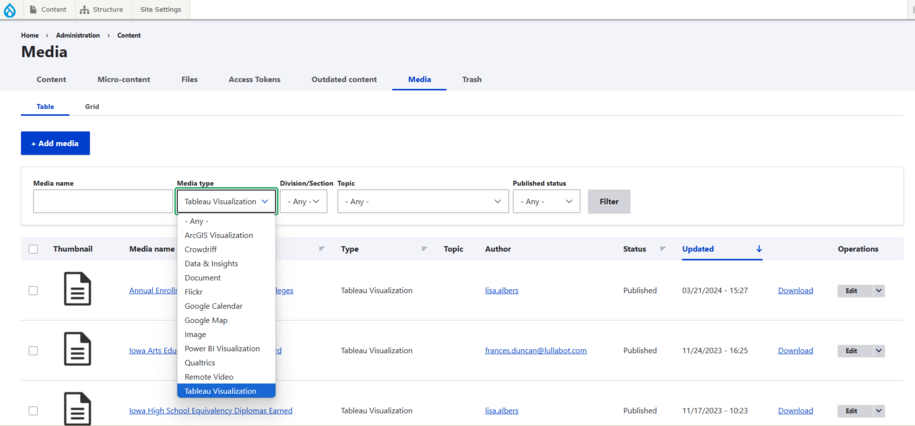
Your saved embeds will appear within the media library section and you can easily locate it by either searching the name of the embed or by searching the media type and selecting Tableau Visualization:
How to Embed Tableau Visualization into a page
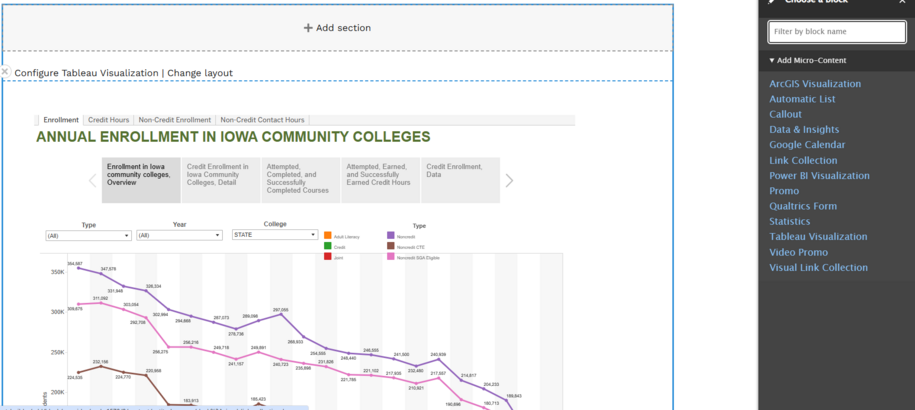
You can add a tableau embed within a landing page just like you do micro-content.
Navigate to the layout button at the right of the edit button and then from there select "Add section" and then "Add block" and within that side bar menu you will see the option to add the Tableau Visualization:
You can also add the Embed within a basic page by selecting the Tableau icon within the WYSWIG tool bar:

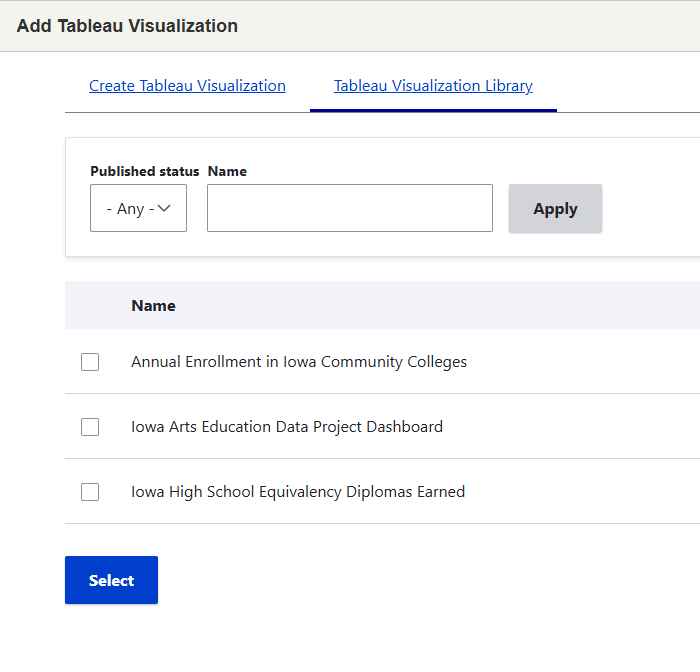
When you select the Tableau button to add it to your page you can have the option to add what you currently already have saved within your library or you can also add a new tableau embed directly here and it will also save within the media library as well:
