
On this page...
Before You Start
A dashboard takes your survey or form data and turns it into a live picture that updates as new responses come in. This guide walks you through building one from the ground up: connecting your data, building widgets, filtering and organizing your pages, and sharing it with the right people.
Before you start, make sure you:
- Have a survey or form that’s already collecting responses (a few test responses are fine too).
- Know what questions you want the data to answer. This decides which widgets you’ll build.
- Have edit access to the Qualtrics project you want to turn into a dashboard.
- Are set up as an Advanced User. Creating a dashboard requires this user type. See Understanding User Types in Qualtrics to check your current access.
If you’re not an Advanced User yet, request an upgrade through ServiceDesk Plus.
A video that covers everything in this guide is on Qualtrics On-Demand: Your Training, Your Time. Each section below links to the matching spot in that video.
Back to topWhat Are Dashboards?
00:00 - Presentation: What Are Dashboards?
A Qualtrics dashboard is a live picture of your survey and form data. It updates on its own as new responses come in.
Use a dashboard to see trends over time, compare agencies, programs, and regions side by side, catch problems early, and give leadership one shared view of the data. You can also use a dashboard to build tables that track forms.
A dashboard has four parts: your data, widgets, filters, and pages. The rest of this guide shows you how to build each one.
Back to topCollecting Data with the Dashboard in Mind
02:36 - Presentation: Collecting Data with Dashboards in Mind
A good dashboard starts before you open the dashboard builder. It starts with how you build your survey. Keep these in mind:
- Start with the end in mind. Build your survey around the questions stakeholders need answered. Then build the survey.
- Keep questions closed-ended. Simple, fixed answer choices are easy to chart. Open text is not.
- Stay consistent. Use the same wording and scales every time, so trends hold up over time.
- Capture your breakdowns. Collect agency, program, region, and channel on every response.
- Use embedded data on purpose. Capture dates, source, and case or program IDs on purpose, not by accident.
- Plan for open text. Limit it, or set aside time to review it. It won’t roll up in most widgets.
- Pilot before you launch. Test the survey, check it in a test dashboard, and fix problems early.
- Protect quality after launch. Don’t change the wording mid-survey. It breaks your trend lines.
Create a Dashboard
22:05 - Dashboard Overview
Creating a dashboard actually creates three things at once: a folder, a dashboard, and a dataset. That’s why you’ll be asked to name the same thing three times in a row. Each one does something different. The folder organizes your project. The dashboard is the canvas you build on. The dataset holds your mapped data.
To get started:
- From your Projects or Catalog page, click Create Project, then choose the Dashboard project type.
- Choose Create from scratch or Create from a copy. Only copy an existing dashboard if your new survey is very similar to the old one. Otherwise your data will map in wrong. When unsure, start from scratch.
- The dashboard opens to a blank screen. This is expected. Widgets can’t be added until a dataset is connected, which is covered in the next section, Add Dataset.
A few things to know:
- A dataset can only be attached to one CX dashboard. To reuse the same survey data on another dashboard, create a new dataset from that source.
- Name your folder, dashboard, and dataset the same thing. It’s easier to keep track of as your list of dashboards grows.
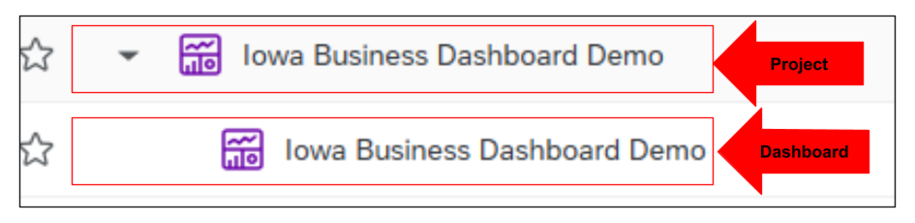
Creating Your Project & Adding a Dashboard (CX)
Back to topAdd Dataset
25:03 - Dashboard: Dataset and Dashboard Data
Before you can build a single widget, your dashboard needs a dataset. This is how your survey or form data gets connected.
Most dashboards only need the Data Mapper. Use it when all your data comes from one survey or form. If you need to combine different kinds of data, like ticket data and survey data, use the Data Modeler instead. It’s built for joining sources together. Unless you know you need to join sources, start with the Data Mapper. It’s faster and works for most cases.
A few things to get right before you map your data:
- Finish your survey first. Qualtrics pulls in every field when you map your data. If you add new questions later, you’ll have to go back and map each one by hand.
- Set scale questions as Number Sets. Qualtrics tags most answers as Text Set by default. For a scale like Strongly Disagree to Strongly Agree, change the field type to Number Set and give each answer a number (1 to 5, for example). This is what lets you sort, average, and build widgets correctly.
- Set up Text iQ before you build the dashboard, if you plan to use it. Text iQ fields, like sentiment score and topic, need to exist in your survey’s Data & Analysis first.
- Give Qualtrics a minute after changes. After you edit a field or add a field group, click Save, then wait a minute or two before checking the dashboard.
Dashboard Settings
31:20 - Dashboard: Settings
Click the gear icon at the top of your dashboard to open Dashboard Settings. This is where you set up how your dashboard works and looks, separate from any one widget.
Dashboard Data
This opens the same window you used to map your dataset. Come back here any time you need to add a field, group fields together, or fix a field type, for example if something is tagged as open text when it should be a text set.
Text iQ
If you use Text iQ, this is where it’s set up for the dashboard. In most cases, set it up in the survey’s Data & Analysis before you build the dashboard. Fields like sentiment score and topic will come in on their own once that’s done. Only set it up here if you’re combining several data sources at once.
Custom Metrics
Qualtrics already has basic math built in, like count, average, min, max, and sum. Use Custom Metrics only when you need something more, like multiplying a score by a certain value under certain conditions. Most dashboards won’t need one.
Theme
This sets your dashboard’s look: header color, background color, and the color scale. You can build your own color palette here using hex codes.
Note: Dashboard Export Permission also lives under Settings. It’s a separate switch, off by default, that controls whether people you share the dashboard with can export it. It’s easy to miss, and a common reason someone’s export button doesn’t work.
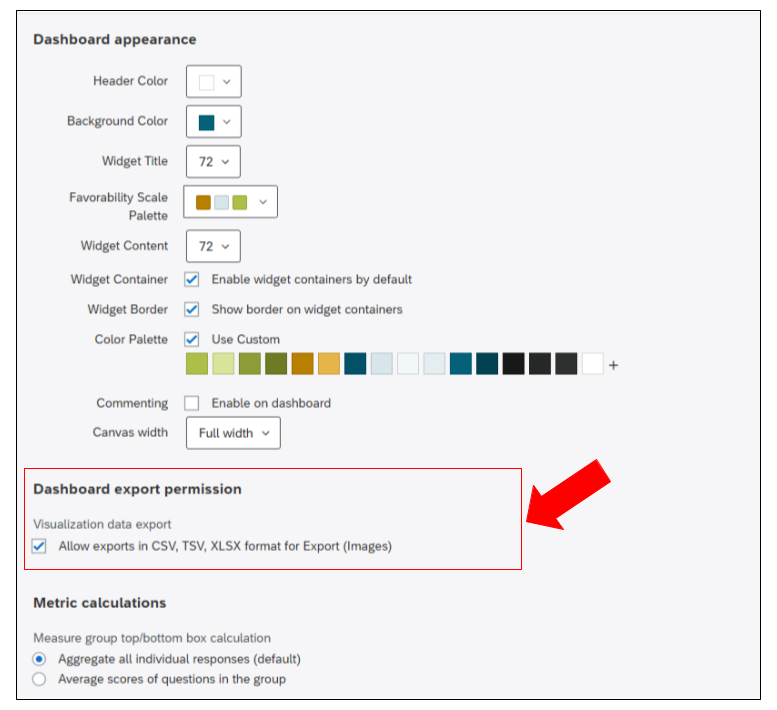
- Text iQ Functionality
- Custom Metrics
- Dashboard Theme
- DX Platform Color Palettes: the official State of Iowa colors, with hex codes in the downloadable PDFs, so your dashboard matches DX branding
Building Widgets
37:00 - Dashboard: Building Widgets
There are over 20 widget types, grouped into five categories: Chart (plots and graphs), Table (grids and tables), Analysis (key driver correlations), Static Content (images and fixed text), and Other (open-ended text, region selections, distribution data).
For the full list of widget settings, metrics, and options, see Building Widgets (CX).
In the video includes a live, show-and-tell walkthrough of building a Rich Text Editor widget, a Number Chart, a Vertical Bar chart, and a Pie/Donut chart, start to finish.
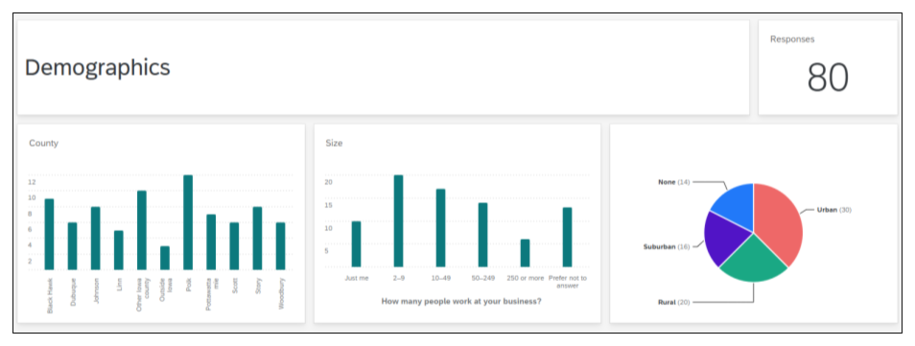
Building Complex Widgets
The Building Widgets section covers the basics, but two widget types go further than a standard chart and are worth their own walkthrough: Matrix Statements in a Single Widget and the Key Drivers Widget. Both take a few extra setup steps, so they’re broken out here in more detail.
Matrix Statements in a Single Widget
52:19 - Dashboard: Matrix Statements in a Single Widget
This is one of the most requested widgets, and also one of the trickiest to build on the first try. It rolls every statement from a matrix question (like a satisfaction matrix with several scale items) into a single chart, instead of a separate widget for each one. Because of that complexity, following along directly in Matrix Statements in a Single Widget is the best way to work through this one.
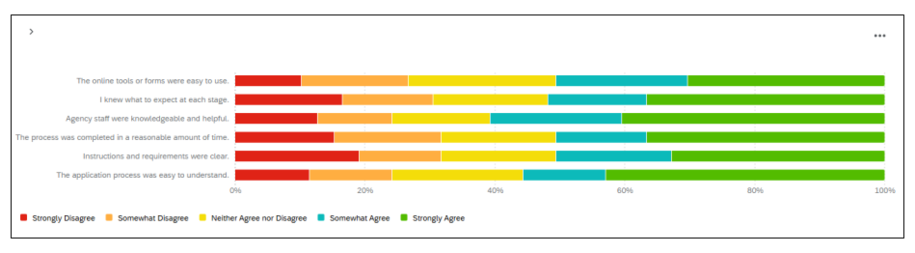
Tip from Qualtrics: if data values aren’t showing, make the widget bigger. Vertical bars use the same steps. Just switch the dropdown from Horizontal to Vertical and everything carries over.
Key Drivers Widget
1:06:47 - Dashboard: Key Driver Widget
1:28:22 - Dashboard: Key Driver Widget (Populated)
This widget answers a question every dashboard needs to answer eventually: of everything you asked about, what actually drives overall satisfaction?
It compares one outcome metric (usually an overall satisfaction question) to several driver metrics (the more specific questions that feed into that outcome). It plots each driver on a grid, with Importance on one side and Performance on the other, and sorts them into four groups:
- Increase Focus: high importance, low performance. Start here.
- Maintain Focus: high importance, high performance. Keep doing this.
- Reduce Focus: low importance, high performance. Fine as-is, but not what’s driving satisfaction.
- Ignore: low importance, low performance. Low priority.
Setting up Key Drivers Widget
- Add a Key Drivers widget. It’s under Analytics in the widget picker and may be labeled “Upgraded Key Drivers Widget.”
- Set your Outcome metric. This should be your overall satisfaction question.
- Add each Driver: the more specific questions that might affect that outcome. You can add up to 50. A survey question counts as 1. A Text iQ topic counts as 2 (one for mention, one for sentiment).
- Pick your Importance method: Pearson Correlation (simpler, doesn’t adjust for overlap between drivers) or Relative Importance (the default, adjusts for overlap, but needs more data and takes longer to load).
- Pick your Performance metric: Top Box/Bottom Box or Average.
A few things worth knowing:
- You’ll need enough responses for this to mean anything. A driver with too few responses may show an importance score of 0. That doesn’t mean it has no effect, just that there isn’t enough data yet.
- A R-squared value in the top-left tells you how well your drivers explain the outcome. Above 60% is strong. Below 20% means your drivers aren’t explaining much, and it may be worth looking for other drivers.
- This widget can take a few minutes to load the first time.
Filters
1:12:29 - Dashboard: Filters
You can filter a CX Dashboard two ways: page filters (apply to every widget on the page) and widget filters (apply to just one widget). Field type decides the kind of filter you get. Text Sets give you a dropdown. Dates give you a calendar.
Adding a page filter
- Click the edit page icon.
- Click Add Filter and choose the field you want people to filter by.
- Optionally rename the filter or change its values.
- Click Done Editing to save.
Warning: if you pick specific values while still in editing mode, then exit, that choice becomes the default for every viewer, not just your own preview. Reset to “All” before you’re done editing, unless you want your last view to be everyone’s default.
Adding a widget filter
- Click the edit page icon, hover over the widget, and click Edit.
- Under Filters, click Add, then pick the field.
- A widget filter only affects that one widget.
How page and widget filters work together
- A page filter normally applies to every widget, even ones with their own filter.
- If a widget filter conflicts with the page filter (for example, page filter shows male respondents, widget filter shows female respondents), the widget filter wins. The page filter is ignored for that widget, which can be confusing if nothing shows that it’s been overridden.
- If the two don’t conflict (for example, page shows male respondents, widget shows ages 18 to 24), both apply together.
Locking filters
You can lock a filter so viewers can’t change it. This works well when a page should always show one specific slice of data, like one store location. Locked filters don’t replace data restrictions. If you need to limit what a viewer can actually access, use data restrictions under Dashboard Sharing & Roles instead.
Set default value from user attribute
For Text Set fields, you can set a filter to default to the viewer’s own attribute, for example their assigned region. This is what makes “each manager sees their own region by default” work, covered more in Dashboard Sharing & Roles. Map your attribute values to your data values, and optionally limit that default to one role.
Date Filters
Date field filters work a little differently than other filters, giving you more control over which period of time you’re looking at.
Setting the date range
- Preset ranges (Today, This Week, Last 7 Days, Last 180 Days, and so on) are dynamic, shifting automatically as time passes.
- Custom Date Range lets you pick a fixed start and end date using a calendar.
- Custom Time Frame lets you filter for a rolling period, like the last 2 quarters.
Shift back by quarter or year
Shift Back adjusts what period you’re looking at relative to today, so you can compare the same stretch of time across years or quarters without manually recalculating dates. For example, filtering for the last 7 days, then shifting back by 3 quarters, shows the equivalent 7-day period from three quarters ago.
Relative filters
Relative filters are a widget-level option, available on lines, bar chart, and table widgets, that shift one widget’s data relative to the page’s own date filter. For example, if the whole page shows the last 7 days, a relative filter on one widget can show that same week from a year earlier, without changing the page filter itself.
Widget-to-widget filtering
You can turn on a setting so clicking a data point in one widget filters other widgets on the page too. It helps viewers explore the data without needing a separate filter.
Back to topDashboard Sharing and Roles
1:18:36 - Dashboard: Roles and Sharing
Sharing a Dashboard
For most dashboards, especially ones shared with a small team, simple sharing is the easiest option.
Click the Share icon in the top right corner of your dashboard, then add the person you want to share with. You’ll choose their access level, starting from the lowest and moving up to the highest:
- View access lets them open the dashboard and look around.
- Edit access gives them full access, including the ability to edit widgets. Once someone has edit access, their export settings can no longer be toggled separately, since edit access already includes it.
You can also add data restrictions, so someone only sees a slice of the data. For example, you can limit a viewer to a specific region, and separately choose whether they can also see roll-up totals across every region, or only their own.
If you don’t want someone seeing every page, you can restrict their access to specific pages instead of the whole dashboard.
Once you’re done, select Save and Notify. The person gets an email letting them know the dashboard has been shared with them.
This approach works well for small or mid-sized groups. For something like a team of five or six people, this is the faster and simpler option, rather than setting up roles.
Dashboard Roles
Roles are built for larger distributions, where adding people one at a time isn’t practical. A good example is sharing a dashboard with over a hundred managers across the state.
A heads-up before you start: role setup is usually turned off by default, and getting into it typically requires fields that tie each viewer to an attribute, like their assigned region. Because of that added complexity, Submit a Qualtrics Request in ServiceDesk Plus to get set up. This is more hands-on support from the team for larger, more complex dashboards, and they’ll help figure out the best setup for your situation.
Once a role exists, you have these permission options:
- View access: can open the dashboard.
- Data restrictions: limits which responses the role sees, by field, with an option to still show totals across everything.
- Page access: limit to specific pages instead of the whole dashboard.
- Export (Images): PDF/JPG export and emailing the dashboard.
- Export (All): adds PPTX, DOCX, CSV, and TSV export, and automatically turns on view access.
- Edit access: lets the role edit widgets, filters, and Settings. Also required for Stats iQ or Text iQ. Usually reserved for your own project team.
Exporting Data
1:30:13 - Dashboard: Table/Record Table and Exporting
- Formats: PDF, JPEG, PowerPoint, and CSV. PDF keeps your page layout. CSV gives raw data, so be careful exporting that from a widget that shows individual responses, like Record Table.
- Single widget exports let you export one chart as an image, handy for dropping into a slide deck.
- Scheduled email exports (weekly or monthly, with a PDF attached) work well for leaders who won’t log into Qualtrics. They get a snapshot in their inbox on a set schedule.
- Don’t forget: Dashboard Export Permission has to be turned on in Settings, or exports won’t work for anyone you share with. This setting is covered in the Dashboard Theme section.
Exporting Data from CX Dashboards
Back to topResources
- Creating a Data Model (CX)
- Creating Your Project & Adding a Dashboard (CX)
- CX Dashboards Roles
- Custom Metrics
- Dashboard Theme
- Data Mapper (CX)
- Exporting Data from CX Dashboards
- Filtering CX Dashboards
- Key Drivers Widget
- Matrix Statements in a Single Widget
- Text iQ Functionality