Purpose
The Qualtrics Heatmap tool shows how people use your website. It lets you see where they click, where they move their mouse, and how far they scroll down the page. This helps you figure out what parts of your site people are paying attention to and what they might be missing.
Note: This feature is only available to Agency Managers.
Heatmap Features
Once you create a heatmap, you will be taken right to it. Alternatively, on the Heatmaps page, you will see your saved heatmaps. Select one to begin viewing the data.
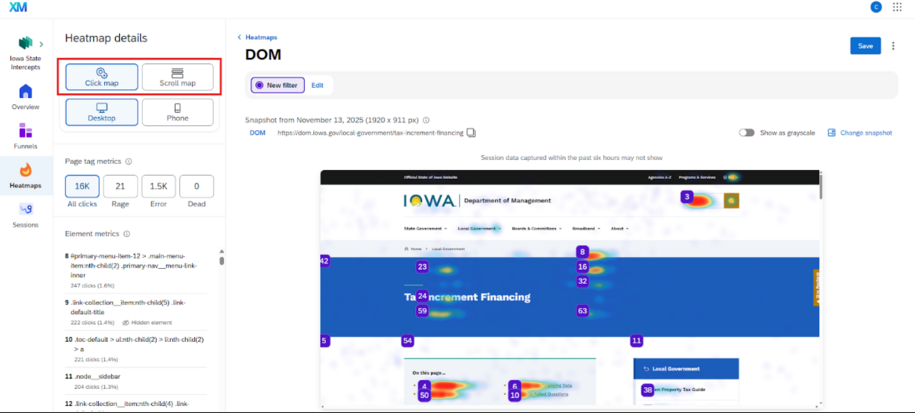
Click Maps
Click maps create a visual representation of user interactivity, which can be extremely useful for mapping out where users are navigating, how often, and whether there are any frustration signals arising from certain elements on the page.
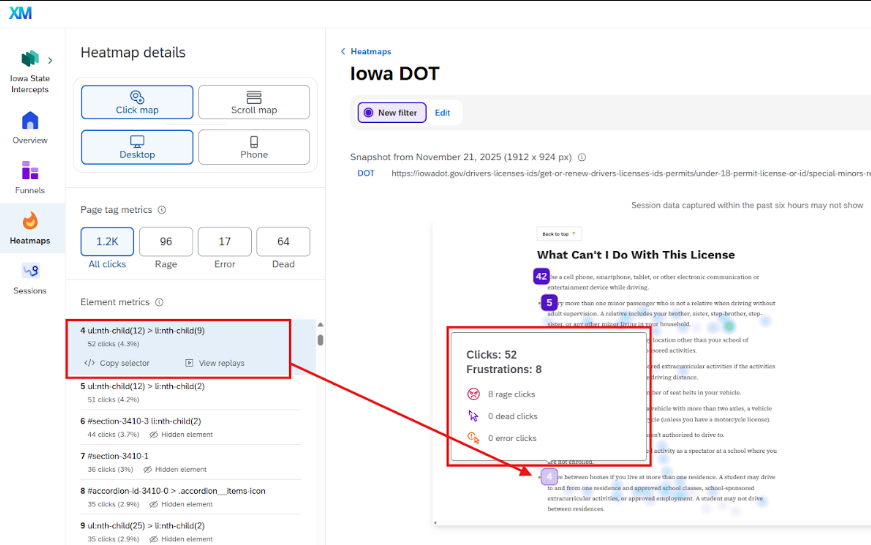
For example, Iowa DOT may want to find out if users are having the issues navigating a popular driver's license resource page. They can do this by creating a filter to view at least a certain number of frustration signals, then clicking on elements within that page to pinpoint where users may be experiencing issues.
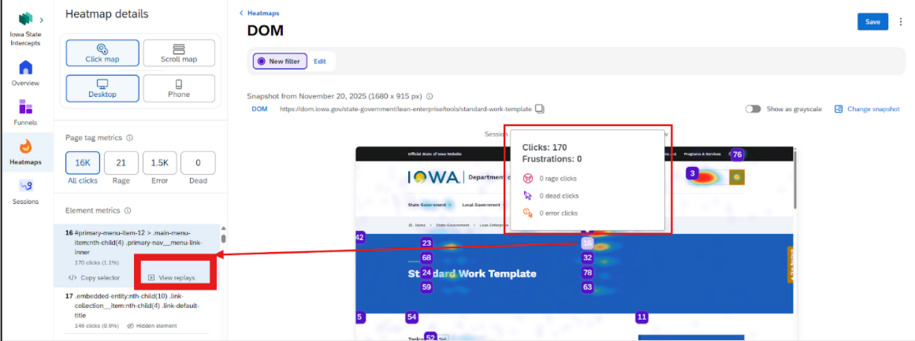
Heatmap User Replays
You can also select the corresponding Element metric under the left side Heatmap details section and view the session replays.
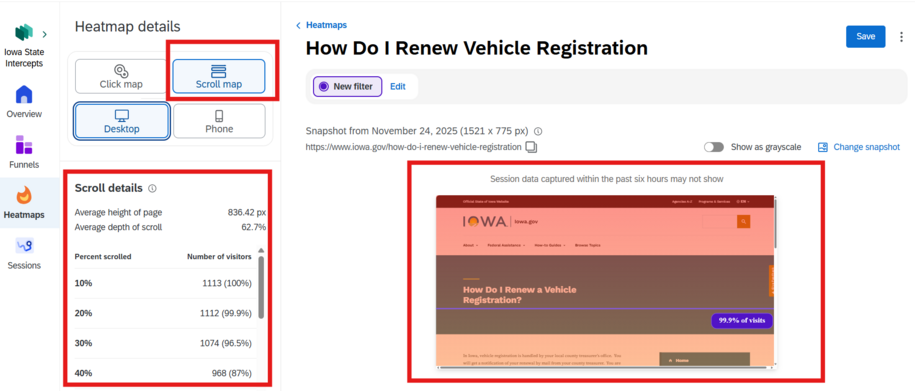
Scroll Maps
Scroll maps provide a color gradient that visually represents how far users scroll down a page. This map also marks important metrics like the average height of the page, the average depth of the scroll, and percentages of visits. You can also get a breakdown of the scroll details in the left side Heatmap details section.
Device Types
Heatmaps can be viewed by users accessing your website via desktop or mobile devices. Do this by toggling between the two options in the left side Heatmap details section.
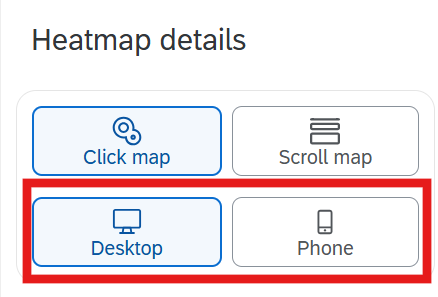
This provides a more granular view of how your users are navigating the page and whether there are significant differences in interactivity between the two device types.
Filtering
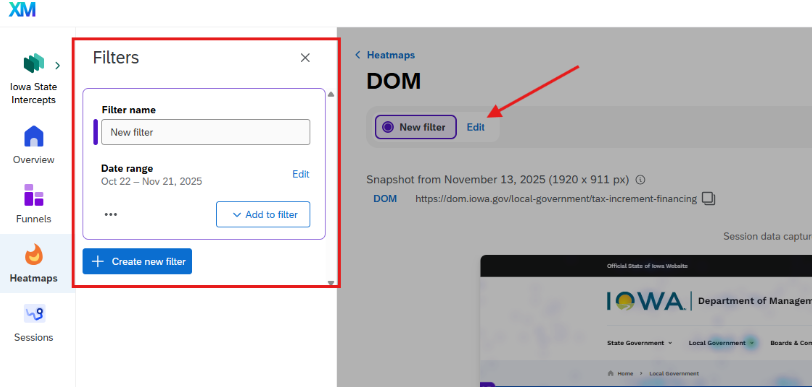
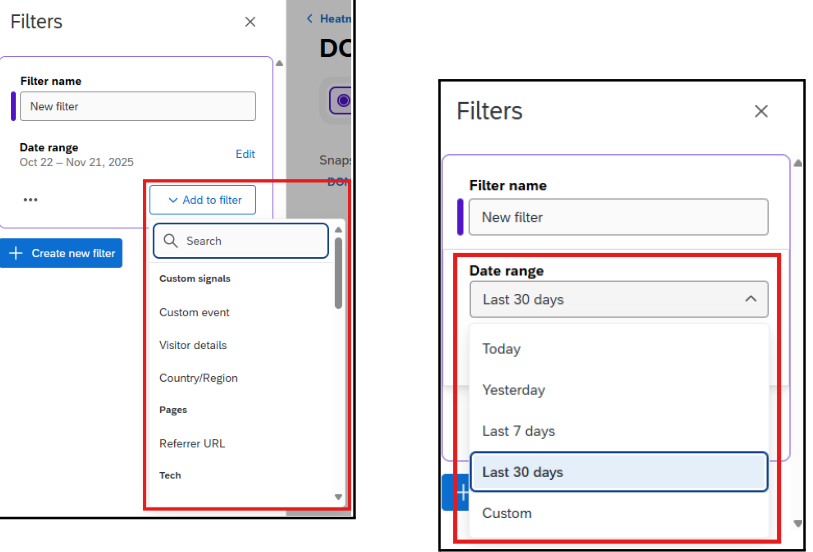
Heatmaps are first set to display data over the last 30 days. However, you can click New filter: Edit to update this to other preset date ranges, including custom ranges.
There is also a wide range of filter options, including Visitor Details, Country/Region, Browser, and Screen Resolution, and frustration signals like rage clicks and dead clicks.
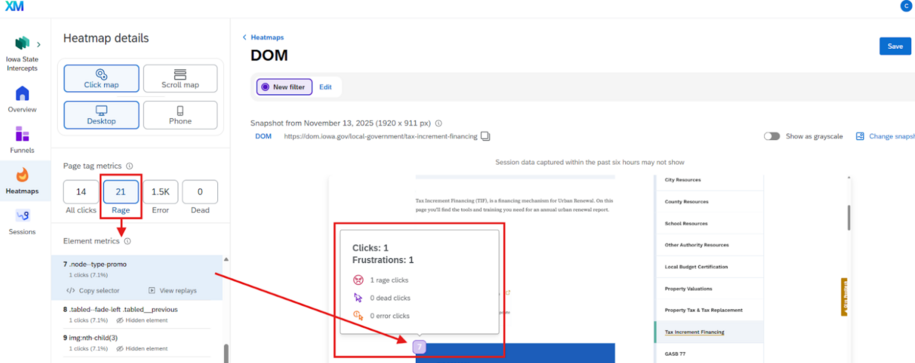
Page Tag Metrics
When viewing the Click map type, you have the ability to narrow down the heatmap data based on Page tag click metrics.
This allows you to get snapshots of user frustrations throughout the page, like where they are experiencing dead clicks or error clicks, or where they tended to rage click.
How to Create a Heatmap
Navigate to Qualtrics Digital Assist to locate the Heatmap tool.
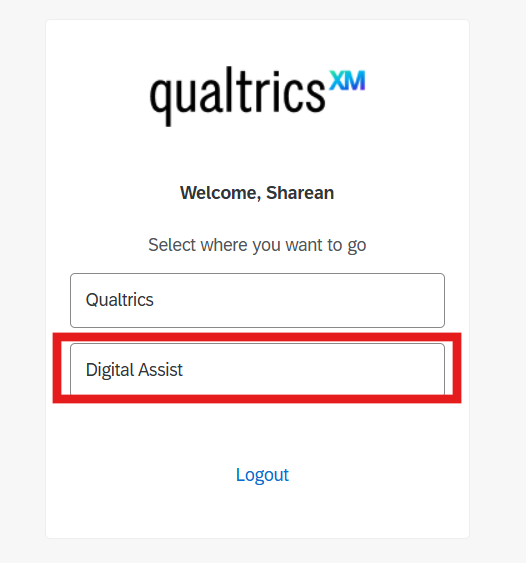
- You can either select the Digital Assist when you go to Engage.iowa.gov
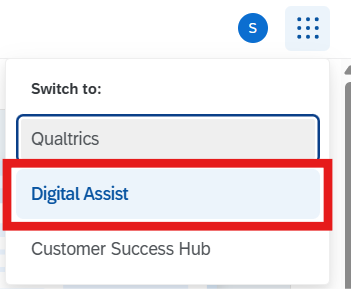
- Or if you are already in your Qualtrics Account you can click on the waffle menu at the top right of the page and select Digital Assist from the dropdown menu
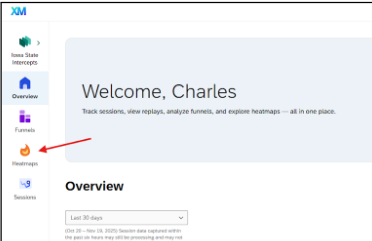
- Select Heatmaps in the left sidebar menu.
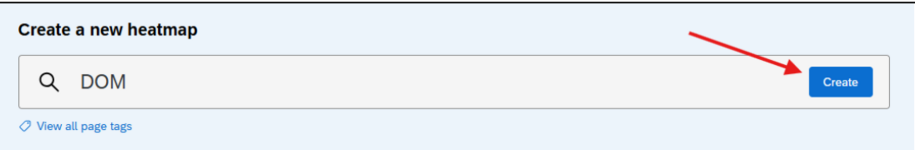
- Click the search bar to manually search for URLs or page tags by your agencies name. Next click the Create button to create your heatmap.
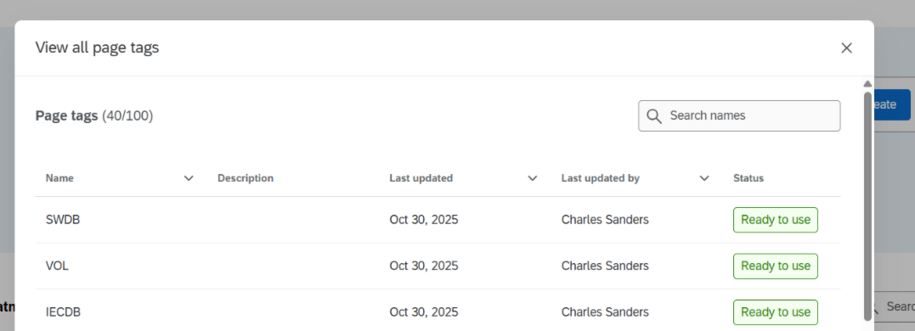
- To see all of the available page tags, click View all page tags.
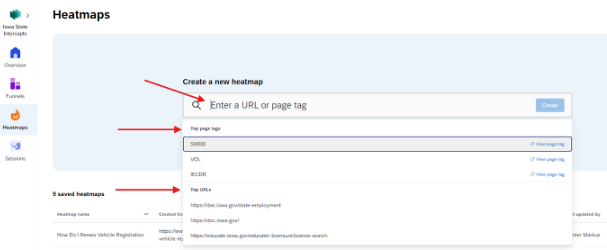
- Select one of the URLs or page tags from the list of results.
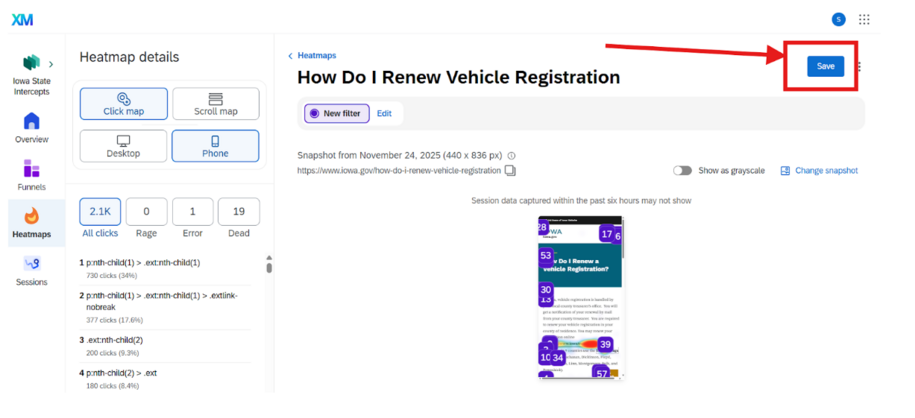
- Once you’ve created a new heatmap, you can easily save it using the blue save button in the right side of the screen.
How to Locate Saved Heatmap
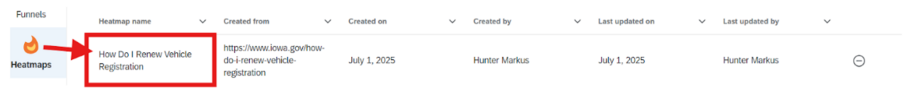
You can use the search field in the far right of the Heatmap dashboard to see your previously saved heatmap pages.
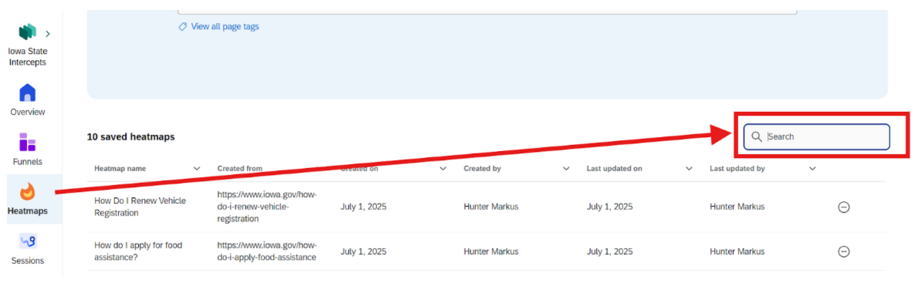
Search either by the page URL or by the name that you made when you saved the heatmap. It will appear in the table below. Select that row so you can now see that heatmap.
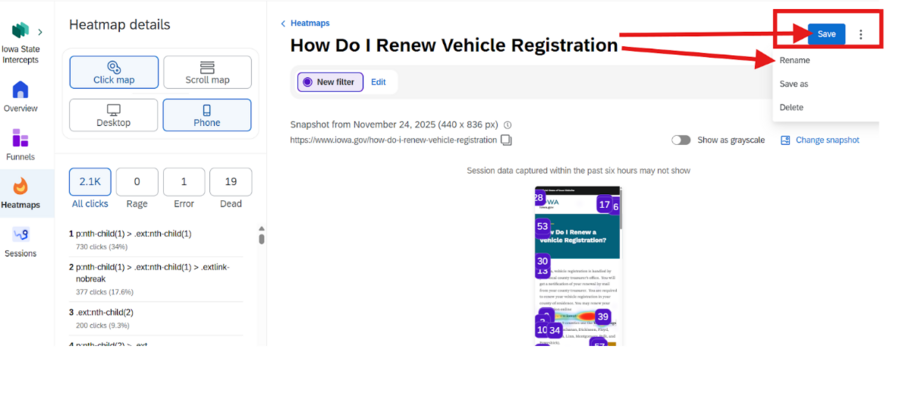
If you ever need to rename a previously saved heatmap or want to delete a heatmap, selecting the 3 dots on the right of the blue Save button.
How to Change the Date in Heatmaps
You can select the Change Snapshot to select a different date for Heatmap user activity.
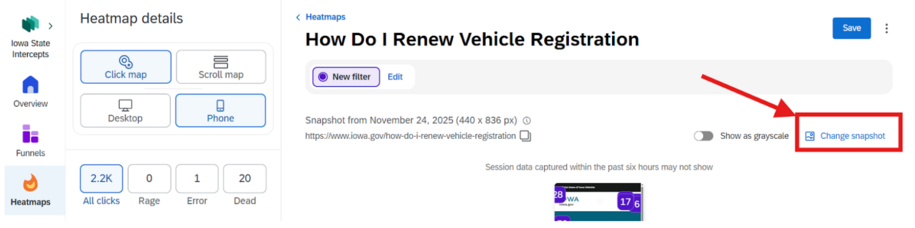
When you select the Change snapshot, you will be able to pick the date from the left side of the menu navigation.
